Distortion in geography refers to the inaccuracies that occur when representing the Earth’s three-dimensional surface on a two-dimensional map.

Since the Earth is a sphere, any attempt to flatten its surface leads to distortions in four key elements: shape, area, distance, and direction. These distortions vary depending on the type of map projection used, making it important to understand how each projection might affect your spatial data.
For instance, the Mercator projection—which is widely used for navigation—preserves angles but significantly distorts the size of land masses near the poles, making Greenland appear much, much bigger than it actually is.

While this distortion might not be important for certain uses, it can pose challenges for applications that demand spatial accuracy, such as drone mapping, geographic information systems (GIS), and cartography.
In this guide to distortion in geography we’ll cover the different types of map distortion, why it’s important for drone pilots to know about the phenomenon, examples, and a lot more.
Here’s a menu in case you’d like to jump around:
Why Is Understanding Map Distortion Important?
Map distortion has far-reaching implications for industries that rely on geospatial accuracy—and particularly for drone operations. Drone pilots and surveyors often depend on precise maps to plan flight paths, analyze drone data, and create deliverables like orthomosaic maps.
Why Distortion in Geography Matters for Drone Pilots
For drone pilots engaged in mapping and surveying, understanding distortion in geography is essential for producing accurate and reliable data. Drone mapping typically involves stitching together aerial imagery to create orthomosaic maps, which require precise alignment of geospatial data. But map distortion can lead to inaccuracies, such as warped imagery, misaligned data layers, or incorrect measurements. By understanding distortion in geography, drone pilots can minimize these risks, and improve the quality and reliability of their outputs. Distortion becomes problematic when mapping large areas, especially near the poles or regions with significant elevation changes. Inaccuracies can impact construction projects, environmental assessments, or infrastructure inspections, where even minor errors can lead to costly decisions. Here are some examples of when distortion matters for drone mapping:- Agricultural monitoring. A drone pilot conducting agricultural monitoring may prioritize projections that minimize area distortion to measure crop health accurately.
- Road mapping. A drone pilot mapping a long road network might opt for a projection that preserves distance.
- Coastal surveying. A drone pilot performing coastal erosion surveys might choose a projection that preserves shape to ensure the accurate representation of changing shorelines.
- Environmental monitoring. A drone pilot conducting large-scale environmental monitoring across regions with varying latitudes may use an equal-area projection to maintain accurate size relationships between landmasses.
How to Minimize Distortion in Drone Mapping
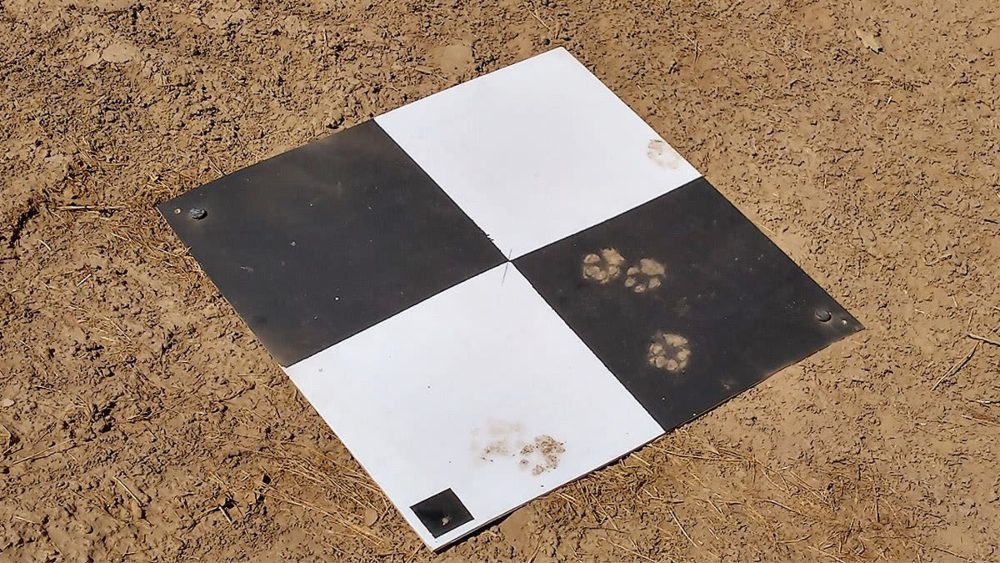
Minimizing distortion in drone mapping requires careful planning and the right tools. By implementing best practices, drone pilots can enhance the accuracy of their maps and reduce errors caused by projection distortions. Here are some best practices for dealing with distortion in drone mapping:- Use Ground Control Points (GCPs). GCPs are physical markers placed on the ground and measured with high-precision GPS equipment. They help align drone images to real-world coordinates, significantly reducing distortion in large-scale mapping projects.
- Use high-quality mapping software. Software such as Pix4D, DroneDeploy, and Agisoft Metashape offer advanced tools to correct distortion and stitch images accurately. These platforms often include options for selecting custom map projections to suit your project needs.
- Fly at the right altitude. Flying at consistent altitudes during your drone missions reduces the risk of introducing uneven distortion into your imagery, especially in areas with varied topography.
Choose the Right Map Projection for Your Drone Project
Map projections play a pivotal role in minimizing distortion for drone mapping. Choosing the right projection helps ensure you get an accurate representation of the area you’re surveying. For small-scale projects, Universal Transverse Mercator (UTM) is a common choice because it minimizes distortion for localized regions. On the other hand, for larger-scale mapping across broader areas, custom projections may be necessary. Here are some tips for choosing a map projection:- Preserve accuracy for specific measurements. If distance is critical, use an equidistant projection. For tasks where area accuracy is paramount, such as land-use analysis, an equal-area projection is ideal.
- Adapt projections to regional needs. Projections like Lambert Conformal Conic work well for mid-latitude regions, while UTM zones are highly effective for narrow, longitudinal areas.
- Consult geospatial professionals or tools. Many GIS platforms, like ArcGIS, can recommend the best projection based on the location and size of your project area.
Types of Distortion in Geography and Map Projections
This chart provides a quick overview of the different types of distortion in geography:| Type of Distortion | Definition | Real-World Example | Impact on Drone Mapping |
|---|---|---|---|
| Shape Distortion | Occurs when the shapes of landmasses are altered on a map. | On a Mercator projection, landmasses near the poles, like Greenland, appear stretched. | Can lead to inaccurate representations of landforms, impacting visual interpretation in drone surveys. |
| Area Distortion | Occurs when the size of regions is exaggerated or minimized. | In the Mercator projection, Greenland appears larger than Africa, despite being much smaller. | Leads to miscalculation of surface areas, critical for agricultural or environmental mapping. |
| Distance Distortion | Occurs when the distances between points are misrepresented. | Distances near the poles on a Mercator projection are greatly exaggerated. | Affects accurate distance calculations for flight paths and route planning in drone operations. |
| Direction Distortion | Occurs when angles or compass bearings are misrepresented. | On certain projections, compass directions between points may not align correctly. | Can result in inaccurate flight navigation for drones, especially over long distances. |
Understanding the Four Types of Distortion in Geography
When representing the Earth’s curved surface on a flat map, distortions in one or more of the following aspects are inevitable. Here are the four ways a map can be distorted:- Shape. Some map projections distort the shape of landmasses, altering how they appear relative to their true form. For example, the Mercator projection preserves angles and shapes near the equator but exaggerates the size of regions near the poles, making them appear stretched.
- Area. Equal-area projections, like the Peters projection, preserve the size of landmasses but distort their shape. For instance, while this projection accurately represents the relative sizes of continents, countries near the poles can appear elongated and flattened.
- Distance. Projections such as the Equidistant Conic aim to preserve accurate distances from specific points, but they distort distances between other locations. This can impact applications like route planning or geographic analysis.
- Direction. Some projections, such as the Mercator, maintain accurate direction for navigation purposes. However, this often comes at the cost of distorting area or shape, as seen with the disproportionate size of Greenland compared to Africa on Mercator maps.
Types of Map Projections
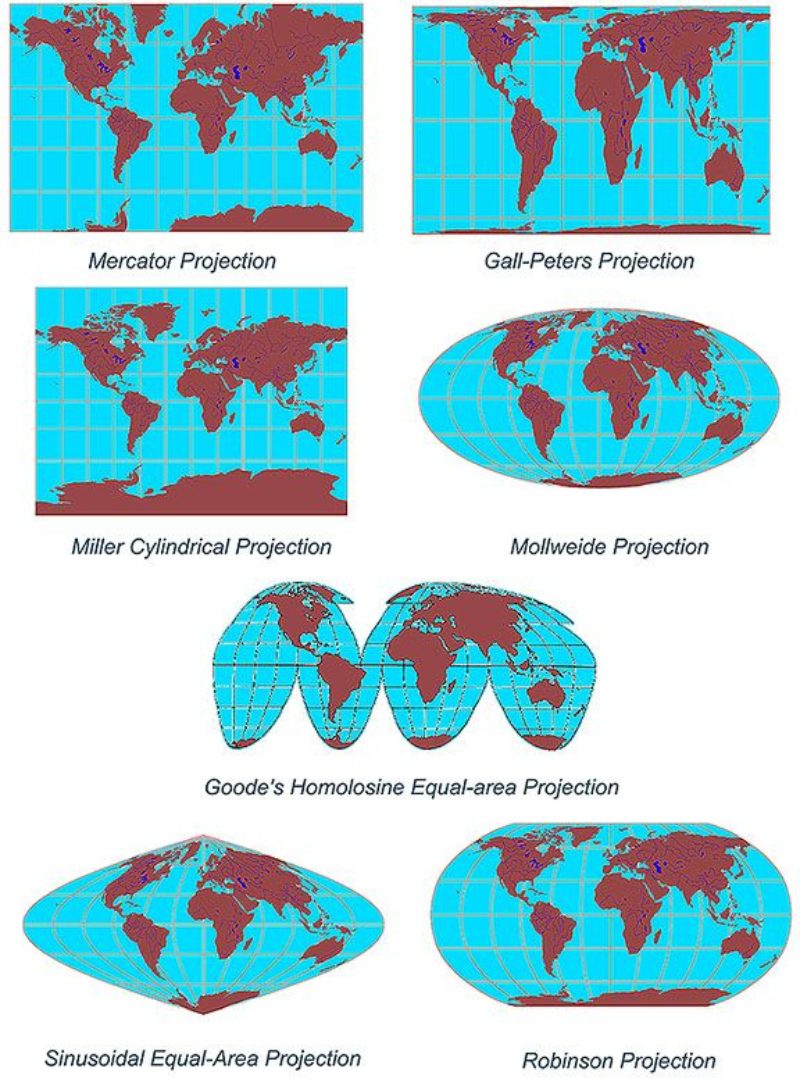
Map projections are methods used to represent the 3D curved surface of the Earth on a flat 2D plane. Each projection distorts certain geographical attributes like shape, area, distance, or direction while preserving others, which means each has unique strengths and weaknesses. The choice of projection depends on the map’s purpose and the importance of preserving specific geographic attributes. Here are some of the most common types of map projections:- Mercator Projection. The Mercator projection is ideal for navigation because it preserves angles and directions. It is particularly useful for maritime and aerial routes. However, it significantly distorts area, making regions near the poles—like Greenland, as we’ve covered—appear much larger than they are in reality compared to equatorial regions.
- Galls-Peters Projection. The Galls-Peters projection, often referred to as the Peters projection, is an equal-area projection that accurately represents the relative size of landmasses. It addresses the area distortions of the Mercator projection, making continents near the equator appear proportional. However, this comes at the cost of shape distortion, which makes some landmasses appear elongated.
- Millers Cylindrical Projection. The Millers cylindrical projection is a modified version of the Mercator projection. It reduces the extreme polar distortion seen in the Mercator while retaining the same general layout of the world map. Although it still exaggerates areas near the poles, it provides a visually balanced representation for global displays.
- Mollweide Projection. The Mollweide projection is an equal-area projection commonly used for displaying global data, such as climate maps. It preserves the proportional size of landmasses, making it suitable for statistical and thematic maps. However, it distorts shapes, particularly near the edges of the map.
- Goode’s Homolosine Equal-Area Projection. Goode’s Homolosine projection combines multiple projection techniques to minimize distortion in area. By splitting the map into lobes, it preserves the relative sizes of continents while reducing shape distortion. This projection is often used for educational and environmental mapping purposes.
- Sinusoidal Equal-Area Projection. The Sinusoidal projection preserves area, making it ideal for mapping global datasets where proportional size is critical. However, it introduces distortion in shape and distance, particularly near the edges of the map. This projection is often used for thematic and climate-related maps.
- Robinson Projection. The Robinson projection is designed to create a visually appealing representation of the world by balancing distortions in shape, area, distance, and direction. While it does not fully preserve any specific attribute, it minimizes overall distortions, making it a popular choice for general-purpose world maps.
The History and Evolution of Map Distortion Awareness
Map distortion has been a challenge for cartographers since the earliest attempts to represent the Earth’s curved surface on flat maps. In the 16th century, Gerardus Mercator introduced his famous projection, which became a staple for navigation due to its ability to preserve direction.
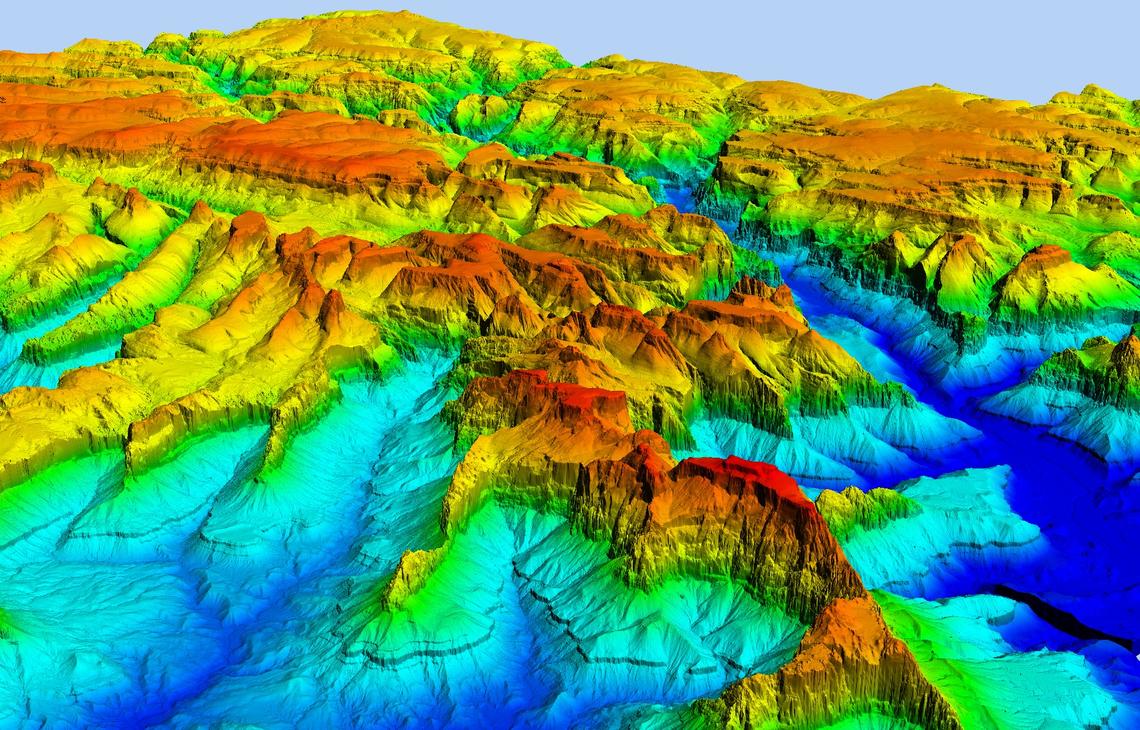
How Technology Is Helping with Geographic Distortion
Advancements in technology have dramatically improved our ability to understand and minimize map distortion. Geographic Information Systems (GIS) and satellite imaging allow for highly accurate geospatial data collection, making it possible to produce maps with minimal distortion. And tools like digital elevation models and 3D rendering further enhance accuracy by representing the Earth’s surface more realistically.